Main page>Blog>Articles>15 KPIs for the Marketing and Sales Departments of an Online Store
Articles
31.07.2023
11,060
15 KPIs for the Marketing and Sales Departments of an Online Store
There are numerous articles about e-commerce KPIs. The problem is that they often present long lists, such as the 50 top KPIs. Indeed, there are many metrics to consider for various business objectives and departments. In this article, we tell you which KPIs are really important to track for an online store.
Let’s prioritize them by rating their importance as follows:
The number of orders is a fundamental metric indicating the operational efficiency of an e-commerce store.
How is it calculated?
The total number of orders is the number of successful transactions (i.e., those recorded in your CRM system and that have reached the processed stage) within a specific period, including orders for products and services.
What does it indicate?
You can use the total number of orders to assess demand, effectiveness of marketing efforts, and conversion rates, as well as to predict a store’s operations.
To gain a comprehensive understanding of your performance and success, consider this metric in the context of other KPIs.
2. Gross Revenue
What is it?
Gross revenue is the total dollar amount gained from sales of products before deducting any associated expenses, such as the cost of goods sold, rent, delivery expenses, taxes, etc.
How is it calculated?
Gross revenue = Number of goods sold × The price of goods sold
What does it indicate?
Higher gross revenue means more money is available to cover fixed costs and generate profit.
If raising prices leads to increased gross revenue, it may suggest that customers are willing to pay more for the given products or services.
If this metric remains stable despite price increases, it could imply a decrease in the number of items sold, indicating that customers are not willing to buy in the same volume as before.
Gross revenue should be evaluated in relation to net profit and profitability.
3. Net Profit
What is it?
Net profit represents the profit generated after covering all expenses.
How is it calculated?
Net profit = Gross profit – (Operating expenses + Taxes)
where
Gross profit = Revenue for a specific period – Cost of goods sold over that same period
Operating expenses include employee salaries, rent, marketing expenses, commissions, order processing costs, and delivery costs, among others.
What does it indicate?
A high net profit indicates that an e-commerce business manages its operating expenses effectively, has achieved high profitability, and can fulfill its financial commitments.
The ability to maintain a high net profit during periods of economic instability or decreased demand indicates competitiveness and resilience to external factors.
Case Study
📊 Increasing Profit in the Graphics Card Category on the TELEMART.UA Online Store
Net Profit Margin reflects an online store’s profit-to-expense ratio, allowing for the evaluation of a store’s effectiveness in generating profit relative to the resources invested.
Profit Margin indicates how many cents of profit has been generated for each dollar of sales.
It’s worth noting that there may be category-specific benchmarks for profit margins.
According to Shopify, the average net profit margin in e-commerce is around 10%. A high net profit margin in e-commerce is approximately 20%, while a low margin would be around 5%.
5. Average Order Value (AOV)
What is it?
The average order value (AOV) defines the average amount a customer spends per transaction.
How is it calculated?
Average order value = Gross revenue within a given period / Total number of orders within that same period
What does it indicate?
A higher AOV means that customers tend to spend more money per purchase, contributing to increased revenue and profitability.
If AOV increases after launching a specific advertising campaign, it may indicate that your marketing team and category managers have successfully implemented their strategy.
The AOV indicator can help you improve revenue planning.
Marketers and the sales department should work to increase AOV. To achieve this goal, they can use various techniques including upselling (to increase the cost of items in the cart, such as by suggesting an iPhone 14 instead of an iPhone 13) or cross-selling (suggesting that customers add items to the cart, such as a case for a phone).
6. Total Number of Sales
What is it?
The total number of sales represents the total number of products sold within a specific period.
How is it calculated?
The total number of sales is usually determined by counting the number of SKU units in transactions.
What does it indicate?
An increase in the total number of sales may indicate growing demand for products, a good pricing policy, effective advertising campaigns, or service improvement.
This KPI also helps your category manager determine which products are most popular among customers and promote them to maximize profit.
Additionally, comparing the total number of sales with other metrics, such as average order value or customer acquisition cost, will help in evaluating overall business profitability and identifying potential areas for growth.
Case Study
🚀 How Pricing Optimization Helped KTC Increase Sales
Website traffic refers to the number of unique users (or visits) to a website within a specific period of time.
How is it calculated?
There’s no formula for “calculating” it. Website traffic is typically collected using analytical tools such as Google Analytics.
What does it indicate?
An increase in website traffic may point to improved brand awareness, scalability of marketing channels, higher search engine rankings, and increased demand for products.
Analyzing traffic data can also help you identify the most popular categories or product pages, to flag problematic areas or navigation deficiencies, and even determine potential opportunities to increase the conversion rate.
8. Conversion Rate
What is it?
The conversion rate measures the effectiveness of a marketing campaign or website in converting visitor sessions into desired actions — typically, e-commerce orders.
How is it calculated?
Conversion rate = (Number of conversions / Number of visitors or sessions during the same time period) × 100%
What does it indicate?
The conversion rate helps you evaluate the effectiveness of your assortment and pricing policies. You can conduct tests, modify page elements, or improve your offers to achieve a higher conversion rate.
E-commerce projects have an average conversion rate ranging from 1% to 4%. However, the average conversion rate varies depending on the industry or region. According to Statista, as of the fourth quarter of 2022, the average conversion rates for the six most popular e-commerce niches were as follows:
Fashion: 2.7%
Health and beauty: 3.3%
Entertainment: 2.5%
Home goods: 2.1%
Electronics: 1.9%
Food and drinks: 4.6%
By understanding industry standards, you can compare your conversion rates and find a starting point for optimizing your business.
9. Return on Advertising Spend (ROAS)
What is it?
ROAS is expressed as a ratio or percentage. This metric shows how many dollars in revenue are generated for every dollar spent on advertising.
How is it calculated?
ROAS = (Revenue from an advertising campaign / Advertising expenses for that campaign) × 100%
To calculate ROAS, you need the following data:
Revenue from the advertising campaign: the total amount of money gained from sales or conversions related to the advertising campaign.
Advertising expenses: the total amount of money spent on advertising within the specific campaign.
What does it indicate?
If ROAS equals 100%, it means that your advertising campaign broke even. Each dollar invested returned one dollar in revenue.
ROAS above 100% indicates positive ad profitability. For example, if ROAS is 200%, it means you gained two dollars in revenue for every dollar spent on advertising.
ROAS below 100% indicates negative ad profitability. For instance, if ROAS is 50%, it means you earned 50 cents in revenue for every dollar spent on advertising.
10. Customer Acquisition Cost (CAC)
What is it?
Customer acquisition cost (CAC) reflects the expenses a company incurs to acquire a new customer.
How is it calculated?
CAC is calculated by dividing total expenses for customer acquisition over a specific period (including marketing expenses, advertising costs, commissions, promotions, and other related expenses) by the number of customers acquired during that same period.
CAC = Advertising campaign expenses / Total number of customers
What does it indicate?
CAC is a measure of the company’s efficiency in acquiring customers.
A low CAC indicates that an online store effectively uses its resources to attract customers. This includes effective marketing strategies, low customer acquisition costs, and high visitor-to-customer conversion rates.
Conversely, a high customer acquisition cost (CAC) may indicate ineffective marketing efforts or ineffective resource management, such as non-performing customer acquisition channels, incorrect pricing, low conversion rates, or poor customer retention after the initial purchase.
Comparing CAC with other metrics, such as customer lifetime value (CLV), shows overall business profitability and helps you make decisions regarding future development strategies. For example, if it costs a lot to acquire a customer but that customer continues to generate revenue for decades through repeated purchases from your online store, attracting them would still be a profitable investment.
11. Customer Lifetime Value (CLV)
What is it?
Customer lifetime value (CLV) is a metric used to determine the value of a customer throughout their lifetime, which refers to the period during which a customer makes orders in your online store and generates revenue. Additionally, this metric assesses the potential profit a company can gain from each customer.
How is it calculated?
Determining CLV involves considering all revenue received from the customer during their relationship with the company and subtracting all expenses related to servicing and retaining that customer.
CLV = (Average customer revenue × Average customer relationship duration) – Average customer acquisition and servicing costs
Most companies will use a year’s worth of data.
What does it indicate?
CLV specifies the effectiveness of customer retention strategies. If CLV increases, it may indicate that the online store provides high-quality service, has personalized offers, and satisfies customer needs. High CLV may also result from selling additional products or services, increasing the average order value, or increasing the purchase frequency.
CLV can also indicate the effectiveness of marketing campaigns and customer acquisition efforts. If a company attracts customers with high CLV, it means that its marketing efforts and channels successfully attract a high-quality target audience that willingly interacts with the brand and makes repeat purchases.
Analyzing CLV allows a store to identify its most profitable customers and focus on retaining them and attracting similar target audience segments. This KPI also assists in pricing decisions, product assortment strategies, marketing approaches, and customer service initiatives.
12. Customer Retention Rate (CRR)
What is it?
Customer retention rate (CRR) displays the percentage of customers who continue ordering your products over a specific period.
How is it calculated?
Customer retention rate = (Number of customers at the end of the period – Number of new customers during the period) / Number of customers at the beginning of the period) × 100%
What does it indicate?
A high CRR indicates that a store successfully retains its customer base and ensures a high loyalty rate. This may result from service improvement, personalized offers, a positive shopping experience, and high customer loyalty.
A low CRR indicates issues with customer retention. It could be due to insufficient customer loyalty, low-quality service, high prices, or other factors.
CRR is an important metric, as retaining existing customers typically costs less than acquiring new ones.
A high CRR allows a store to reduce the customer acquisition cost (CAC) and increase the customer lifetime value (CLV), contributing to increased business profitability.
13. Order Fulfillment Rate
What is it?
The order fulfillment rate reflects the percentage of orders that have been processed and delivered on time.
How is it calculated?
Order fulfillment rate = (Total number of fulfilled orders / Total number of accepted orders) × 100%
What does it indicate?
A high order fulfillment rate indicates that a store successfully fulfills its commitments to customers. This may result from efficient inventory management, timely order processing, fast delivery, and quality service. A high order fulfillment rate signifies a high level of customer trust and satisfaction.
Analyzing this metric allows an online store to identify weaknesses in the order fulfillment process (for example, situations where the website marks the product as in stock but it’s actually out of stock) and improve its service. This can become a straightforward growth point for your business.
14. Inventory Turnover Rate
What is it?
The inventory turnover ratio measures how many times a company sells and replaces its inventory within a given period of time.
How is it calculated?
Inventory turnover = cost of goods sold for a certain period ÷ average inventory for the same period.
Note: When calculating inventory turnover, use the cost of goods sold in the formula instead of the cost of sales to avoid a misleading result. The average inventory is taken at cost, not retail value.
What does it indicate?
It gives an indication of how effectively the category manager is managing the inventory.
We have already explained this KPI in the inventory turnover section of our article on the top 6 KPIs for category managers and dashboards for tracking them.
15. Net Promoter Score (NPS)
What is it?
The net promoter score (NPS) determines the level of customer satisfaction. It is generated based on survey results, where respondents are asked to rate from 0 to 10 whether they would recommend an online store to their friends or coworkers.
How is it calculated?
Respondents are usually classified into three categories: promoters (rating 9-10), passives (rating 7-8), and detractors (rating 0-6). Then, the difference between the percentage of promoters and detractors is calculated to give the NPS score.
NPS = Percentage of promoters – Percentage of detractors
What does it indicate?
A low NPS may indicate issues faced by customers. These could be related to poor-quality products, ineffective customer service, delivery problems, or other aspects of the customer experience.
NPS is an important metric, as it reflects not only the level of customer satisfaction but also customers’ willingness to share positive experiences and recommend an online store to others. A positive NPS can lead to an increase in new customers through recommendations and a higher number of repeat purchases. Conducting deep interviews with detractors and analyzing their responses can help identify weaknesses in your products or services, providing valuable insights on areas that need to be fixed.
25 KPIs That Every Category Manager Should Know
Unlock the essential checklist for Category Managers: Dive into key KPIs, their definitions, and calculation formulas now!
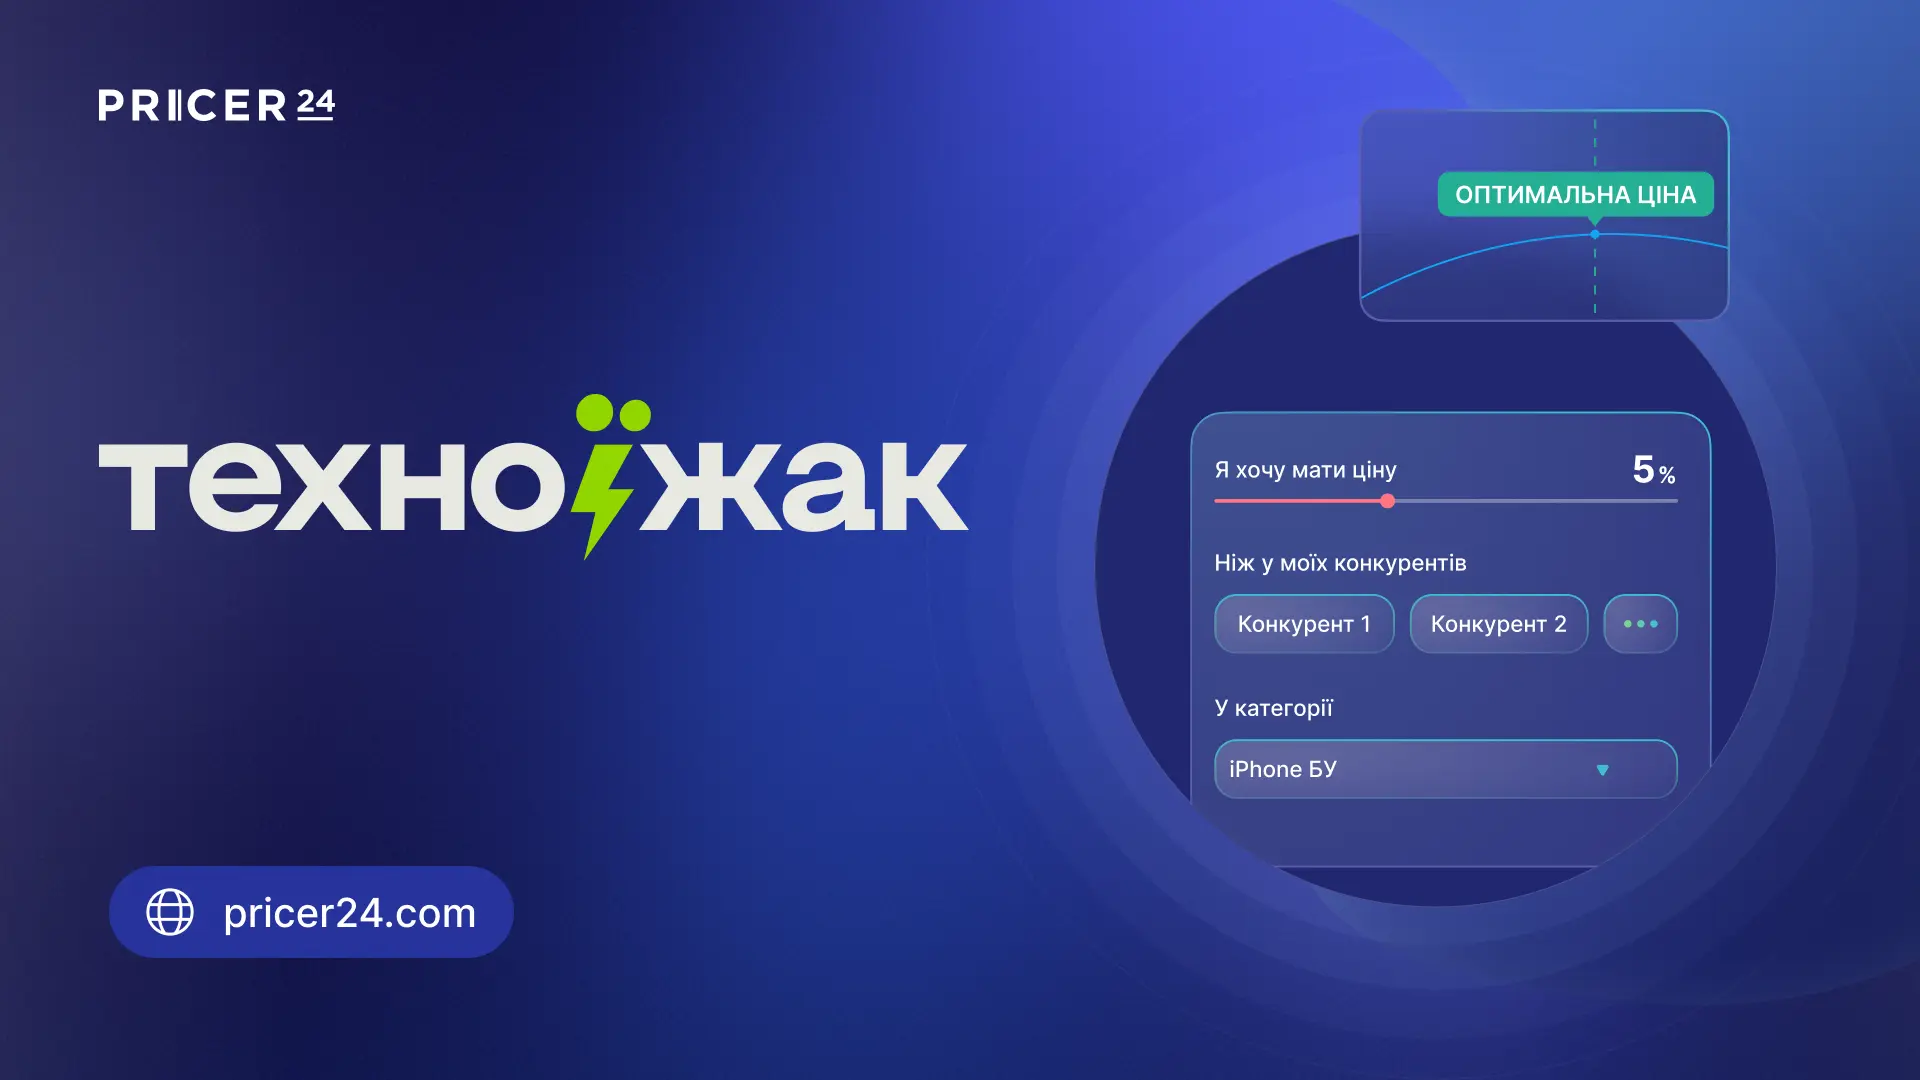
With the Pricer24 platform, your e-commerce business can track competitor data, including:
Real-time product prices
Historical price change data
Product availability status
Historical changes in product availability status
Number of product reviews
Availability of product promotions
And so on
For more details on how competitive intelligence automation helps you make data-based decisions and achieve planned e-commerce KPIs, read our next article.
Summary
Key performance indicators (KPIs) are a compass. They direct your attention to areas that need improvement. However, if you track a large number of KPIs without understanding the goal, it can amount to gathering data for data’s sake.
While some KPIs may contribute to particular company objectives, others may have minimal significance. That’s why it’s crucial to select key performance indicators (KPIs) that are in line with specific company goals. You may make significant progress by carefully choosing and monitoring the right KPIs.
Submit a request, and we’ll show you what top-tier pricing analytics looks like.
"*" indicates required fields
Privacy policy
Your privacy is very important to us. We want your work on the Internet to be as pleasant and useful as possible, and you quite calmly used the broadest range of information, tools and opportunities that the Internet offers.
The personal information of the Members collected at the time of registration (or at any other time) is mainly used to prepare the Products or Services in accordance with your needs. Your information will not be transferred or sold to third parties. However, we may partially disclose personal information in special cases described in the “Consent with the mailing”
What data is collected on the site
At voluntary registration on reception of dispatch you send the Name and E-mail through the registration form.
What is the purpose of this data?
The name is used to contact you personally, and your e-mail for sending you mailings of newsletters, news, useful materials, commercial offers.
Your name and e-mail are not transferred to third parties, under any circumstances, except for cases related to the compliance with the requirements of the law.
You can refuse to receive mailing letters and remove your contact information from the database at any time by clicking on the unsubscribe link present in each letter.
How this data is used
With the help of these data, information on the actions of visitors on the site is collected in order to improve its content, improve the functionality of the site and, as a result, create high-quality content and services for visitors.
You can change your browser settings at any time so that the browser blocks all files or notifies you about sending these files. Note at the same time that some functions and services will not be able to work properly.
How this data is protected
To protect your personal information, we use a variety of administrative, management and technical security measures. Our Company adheres to various international control standards aimed at transactions with personal information, which include certain control measures to protect information collected on the Internet.
Our employees are trained to understand and follow these control measures, they are familiarized with our Privacy Notice, regulations and instructions.
Nevertheless, despite the fact that we are trying to protect your personal information, you too must take measures to protect it.
We strongly recommend that you take all possible precautions while on the Internet. The services and websites that we organize include measures to protect against leakage, unauthorized use and alteration of the information we control. Despite the fact that we are doing everything possible to ensure the integrity and security of our network and systems, we can not guarantee that our security measures will prevent illegal access to this information by hackers from outside organizations.
If this privacy policy is changed, you will be able to read about these changes on this page or, in special cases, receive a notification on your e-mail.