Main page>Blog>Guide>Assortment Analysis for Brands in E-Commerce: A Practical Guide
Guide
13.03.2026
799
Assortment Analysis for Brands in E-Commerce: A Practical Guide
Monitoring your brand’s presence across partners requires consistent work with data. The goal is to identify growth opportunities, optimize collaboration with online stores, and, ultimately, increase sales. Let’s break down how to effectively build a data-driven assortment analysis for brands process using the analytics tools in Pricer24.
Disclaimer: While the analyses presented in this article are based on examples from Ukrainian online stores with prices shown in UAH (Ukrainian Hryvnia), Pricer24 is a global platform and can be used to analyze digital shelves, product availability, pricing, and competitive positioning across various markets and currencies.
Maria works as a sales manager at the regional office of a laptop manufacturer.
One of Maria’s quarterly KPIs is to increase the brand’s digital shelf share by 15%. When a customer visits a partner’s website, they should only see laptops from her brand that are in stock — not product listings with gray “Out of stock” labels or, even worse, no laptops from her brand criteria.
To analyze the current situation, Maria needs to answer the following questions:
What percentage of the assortment is out of stock?
How many of the manufacturer’s models are not listed in partners’ catalogs at all?
Which partners represent the brand best (and worst)?
Just a month ago, Maria would have approached this task using the following process:
Open partner websites in nine browser tabs.
Manually check the availability of each of her brand’s 79 laptop models. For each model: search, scroll, click, and check whether it’s available, out of stock, or not listed in the partner’s catalog.
Then fill out an Excel file and analyze the data to clearly see the percentage of products that are unavailable for purchase on each partner’s website.
This would have taken one or two full workdays. Maria’s fingers would hurt from scrolling, and her eyes from switching between tabs and spreadsheet cells. And worst of all, by the time she finished the review, the data from the first websites she analyzed might already be outdated.
Now, Maria completes this task in five minutes — because she has Pricer24.
Smart Solution: Assortment Analysis For Brands in Pricer24
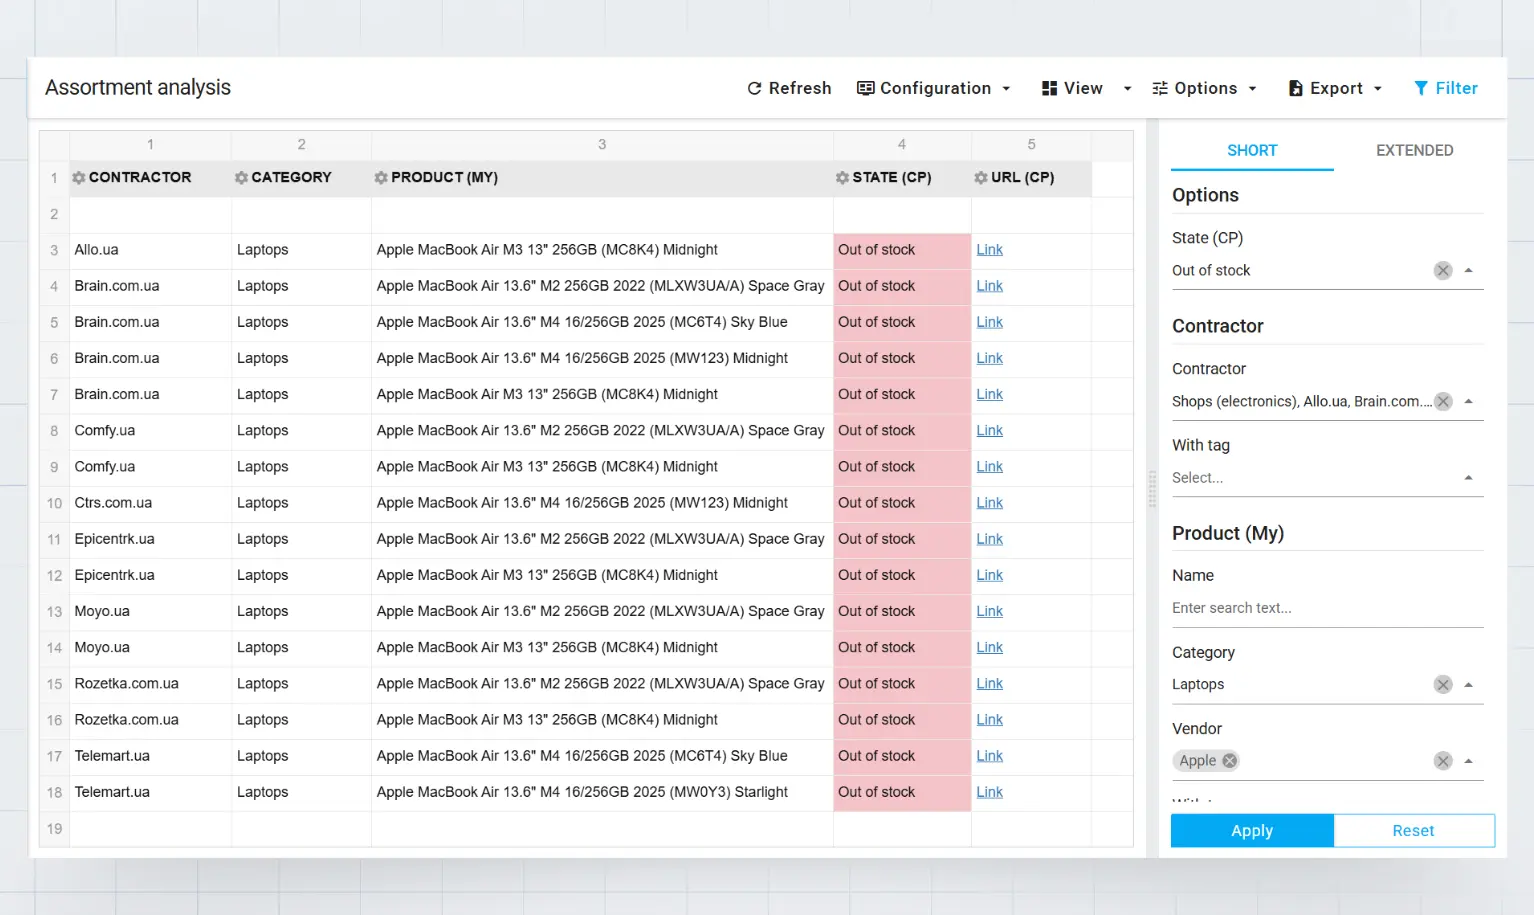
Maria uses the Assortment Analysis Report in Pricer24, which shows product availability on partners’ websites. This information can be displayed in different formats. Let’s look at the most convenient data views for her task.
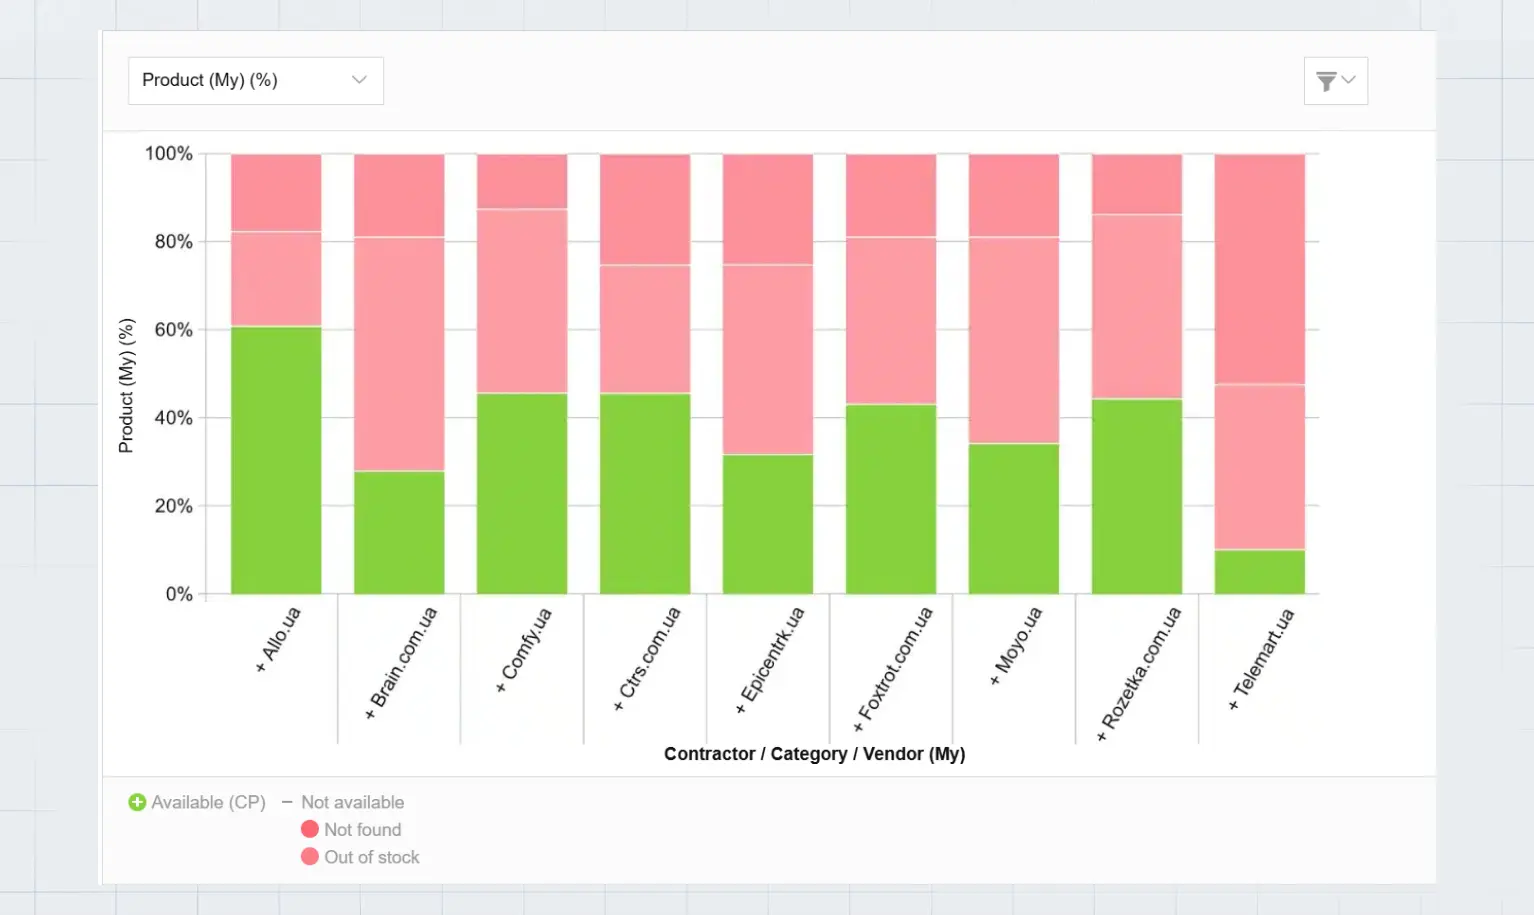
1.Histogram showing the percentage of the manufacturer’s SKUs with different statuses across partners’ websites
Green — % of the brand’s products that are available on the partner’s website
Pink — % of the brand’s products that are out of stock on the partner’s website
Light pink — % of the brand’s products that are not listed in the partner’s catalog
With this chart, the overall market trend can be understood in five seconds:
On Allo, the brand’s product presence is the strongest (~60% of products are in stock).
On Telemart, the presence is critically low (only ~10% of products are in stock).
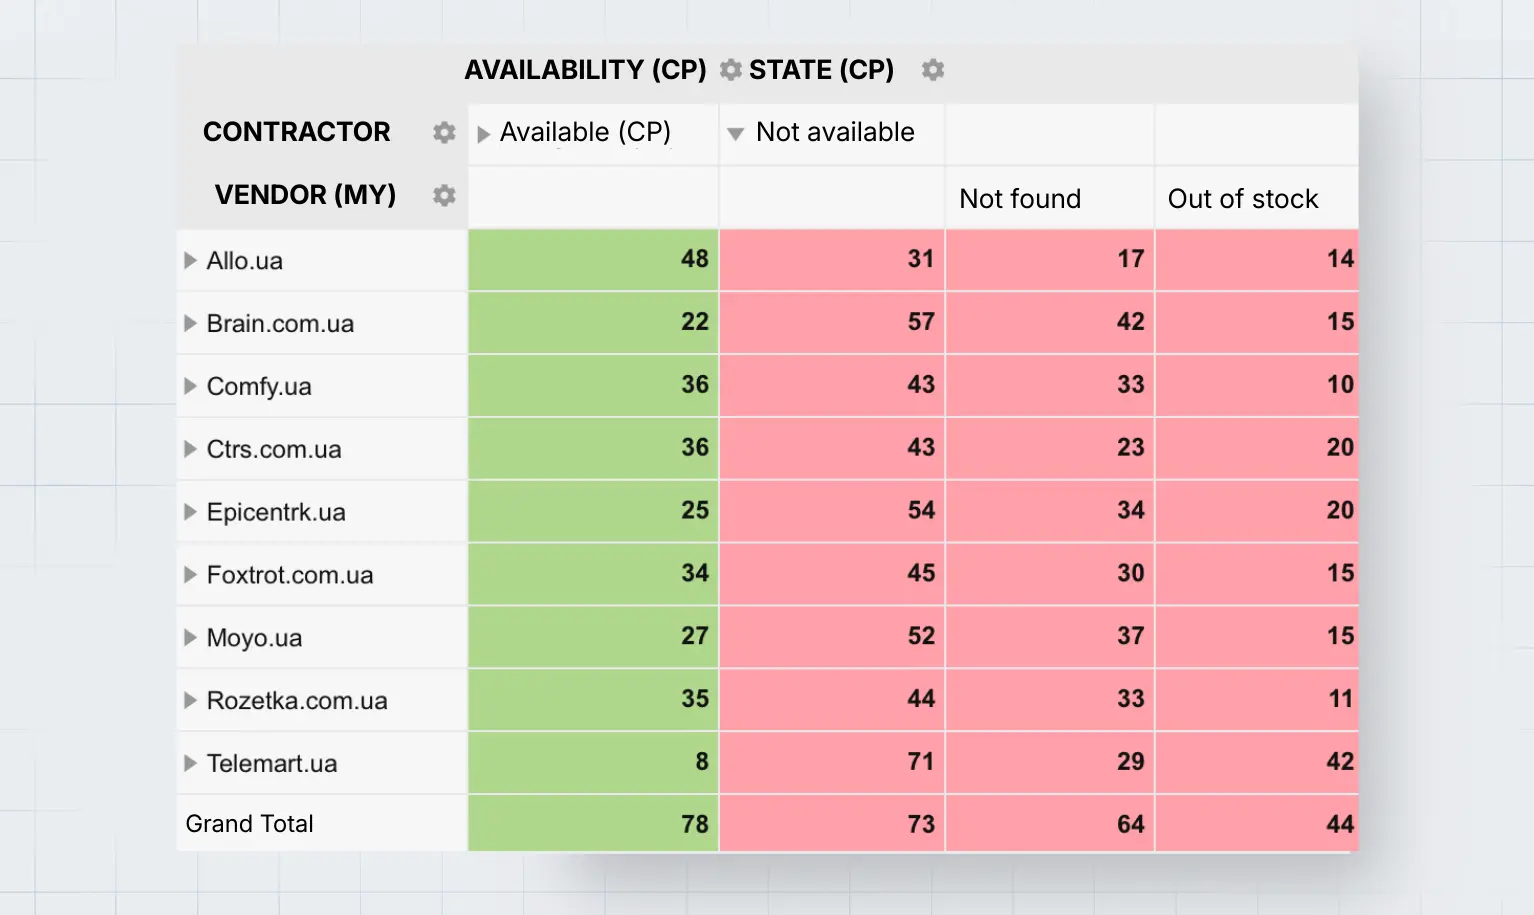
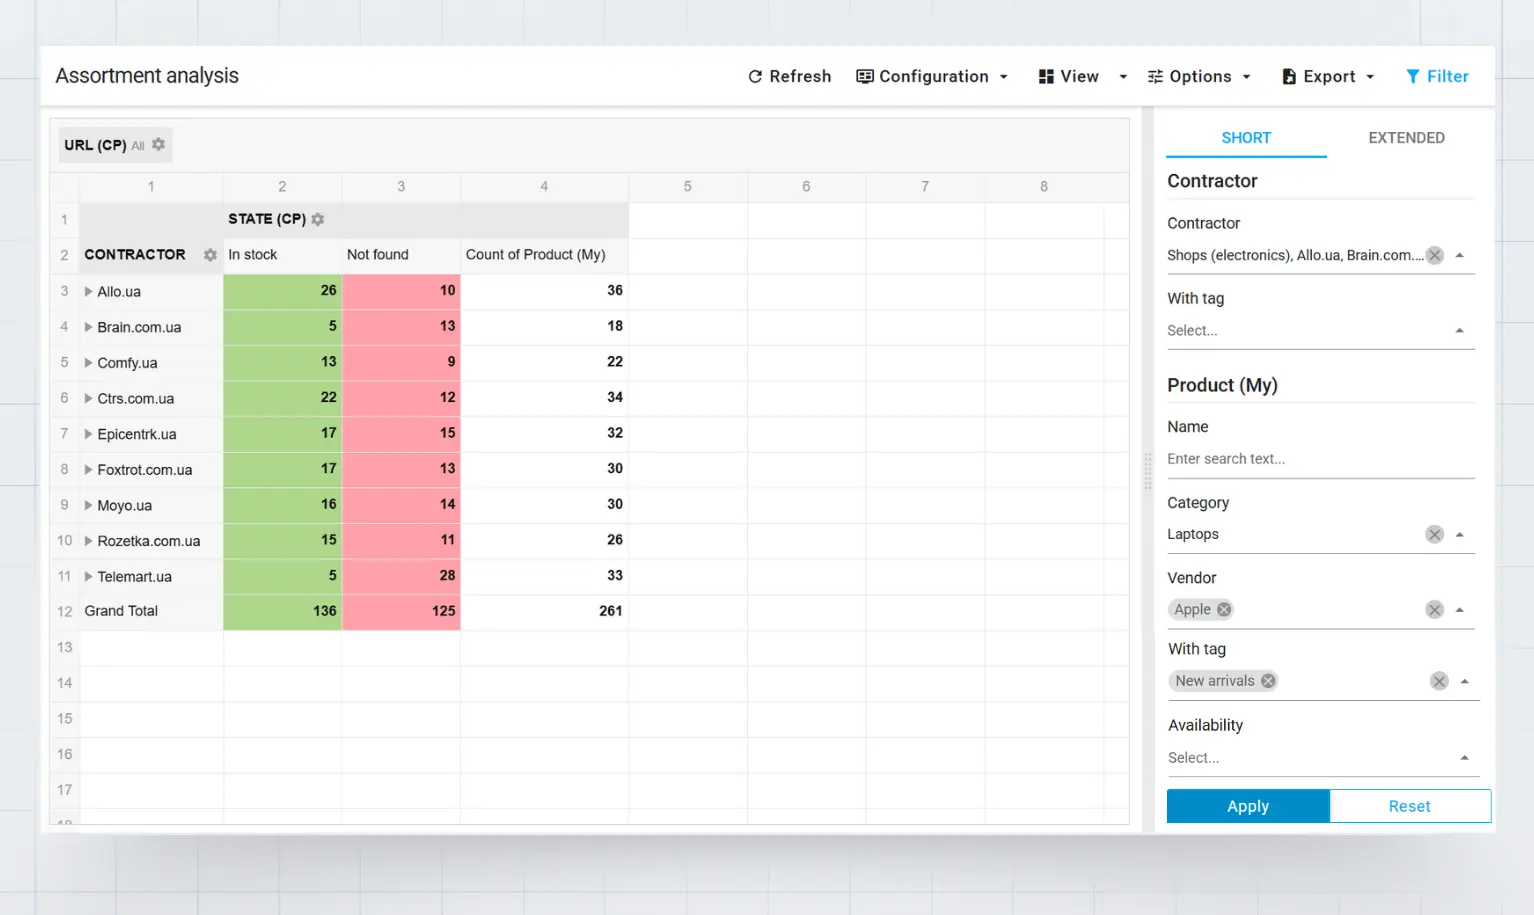
2. Table showing number of the manufacturer’s SKUs with different statuses across partners’ websites
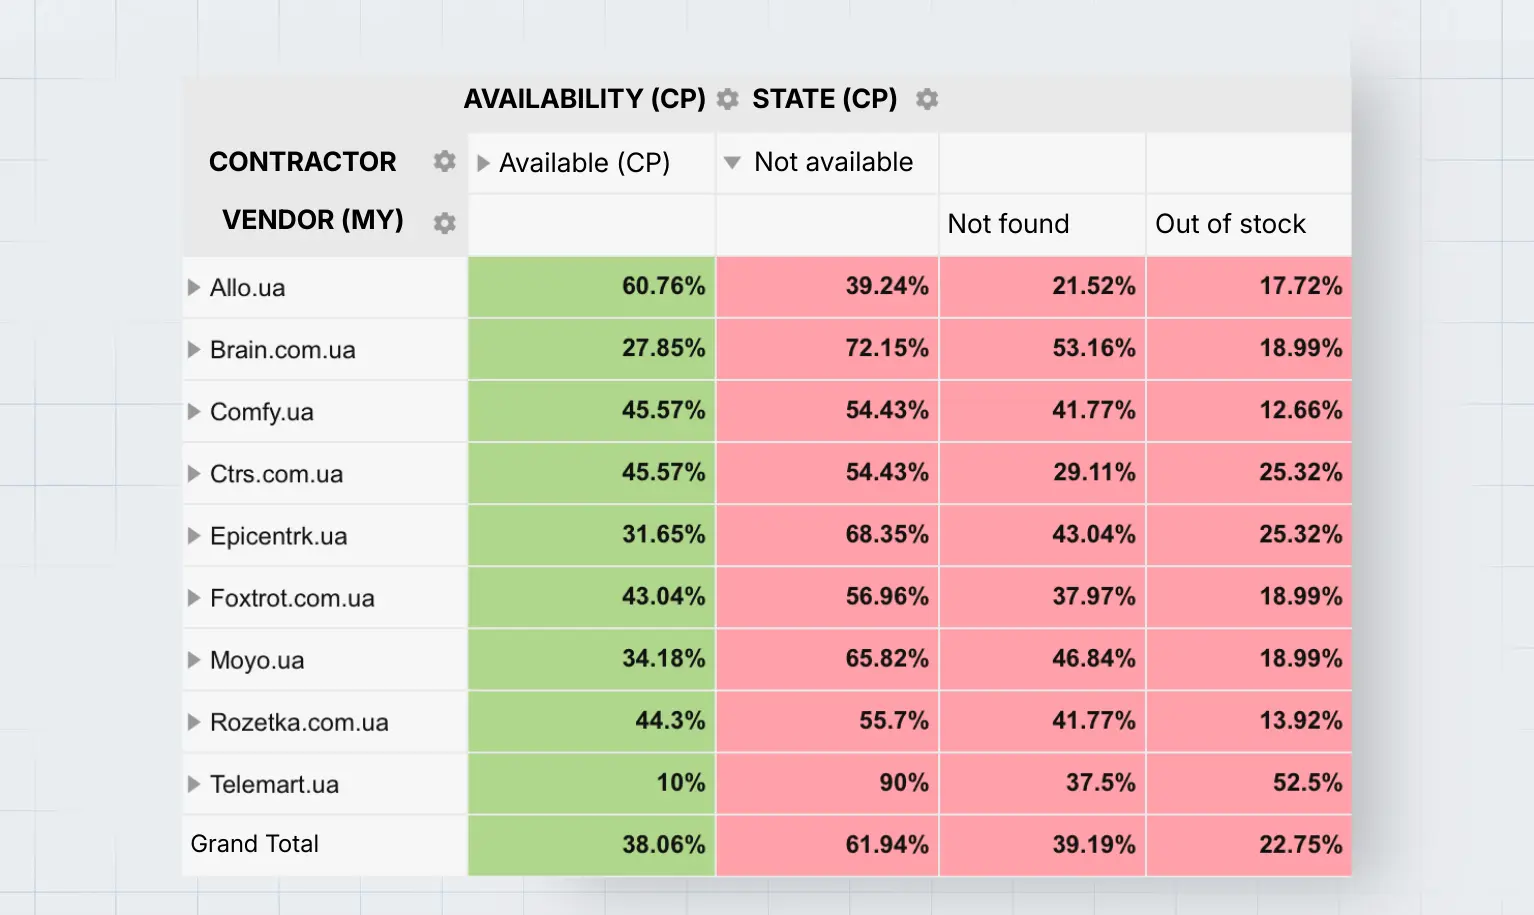
3. Table showing percentage of the manufacturer’s SKUs with different statuses across partners’ websites
Maria found that, on average, partners display only 38% of her brand’s products, 23% are out of stock, and 39% are not listed in catalogs. Key insights:
At Telemart, 90% of the assortment is unavailable, and most products aren’t even listed.
Allo has the best product presence, with over 60% of the manufacturer’s SKUs available.
Now, Maria wants to see how many of her brand’s products are not represented in any partner store. She configures the report as follows:
Rows — one row for each of the brand’s models
“Not Found” column — the number of partners that do not list the model in their catalog
Maria filters the Not available column from highest to lowest:
It turns out there are no such items — her brand has nine partners, and no item is currently not available in nine stores. However, she already sees a problem: Certain models urgently need expanded distribution, as they can only be purchased online from one or two out of nine partners.
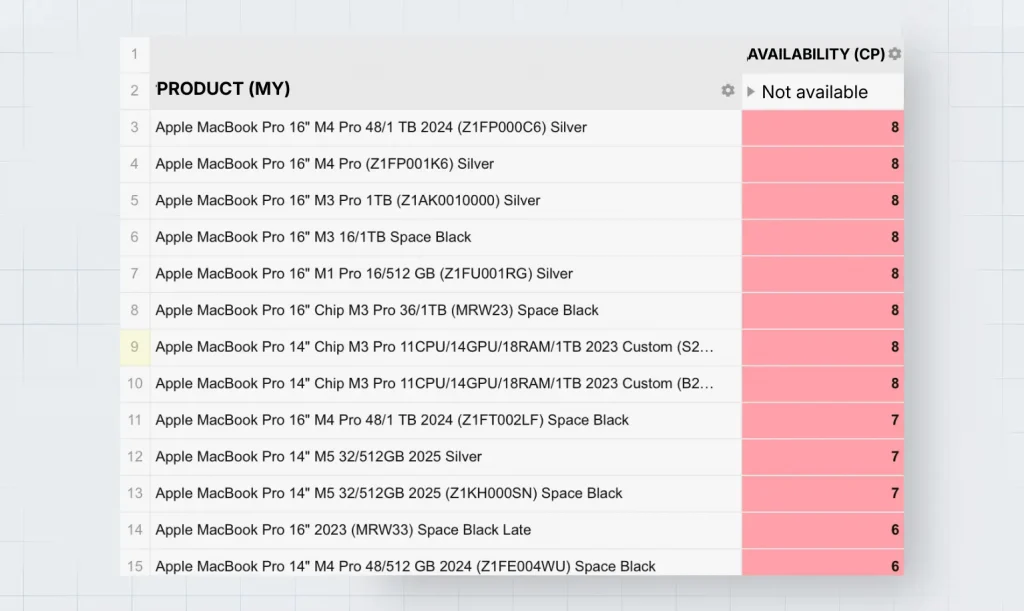
To form a plan of action, Maria creates a view showing all partners and the number of unavailable products at each.
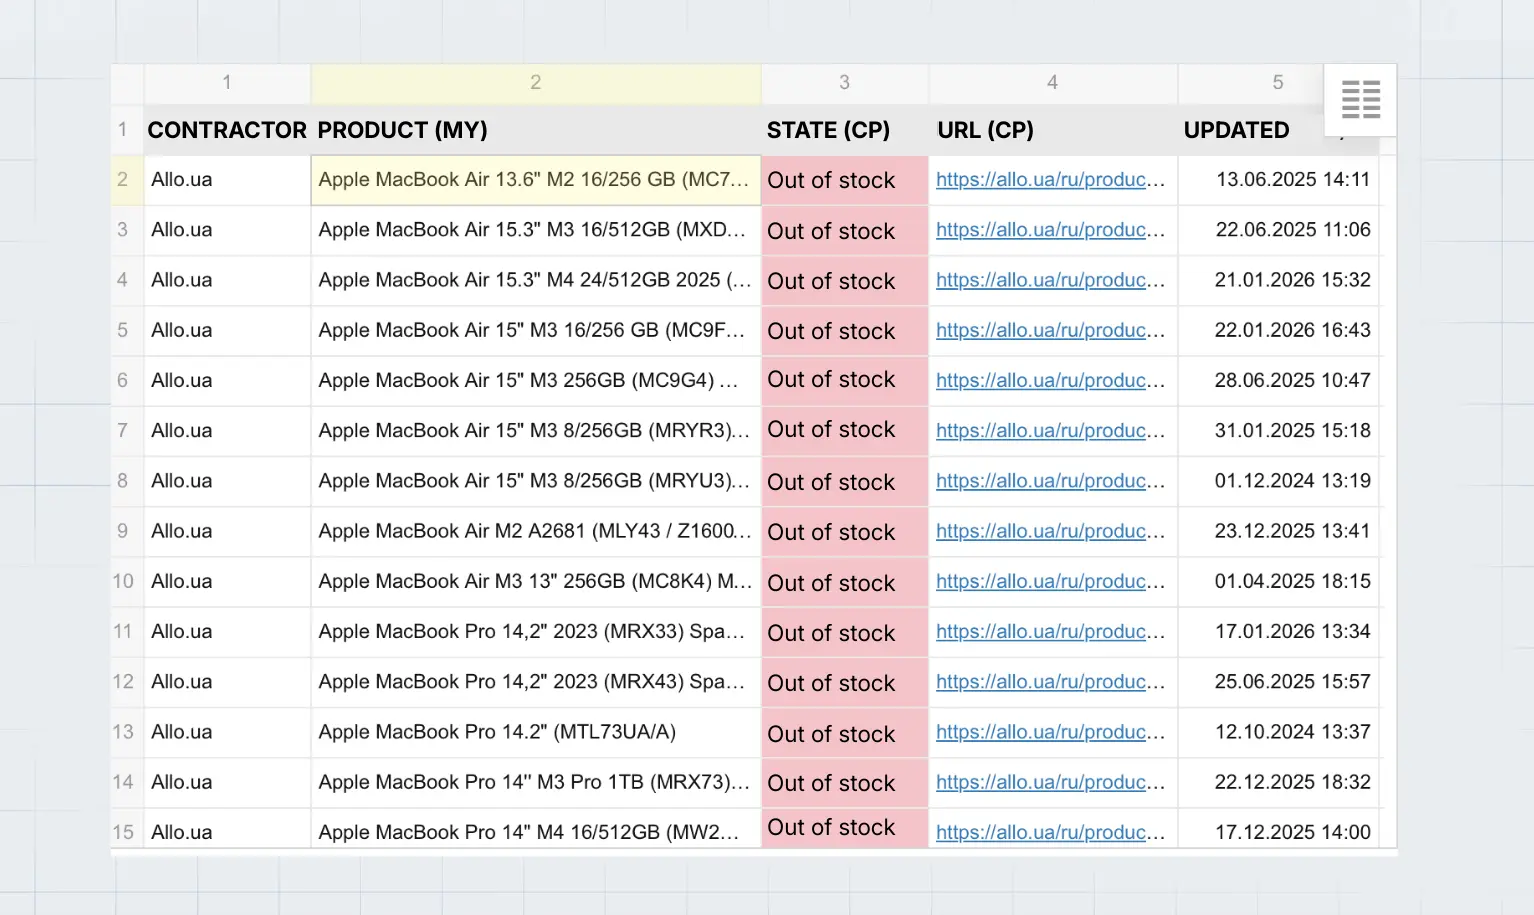
Then, she selects a specific partner and clicks on the number of products in the red “Out of Stock” column. This loads a detailed table of out-of-stock products on the partner’s website.
In the table, Maria can see:
Full product name
Product availability status (“Out of Stock”)
Link to the product page on the partner’s website
Exact date and time when the product went out of stock
If needed, this data can be exported in a convenient format.
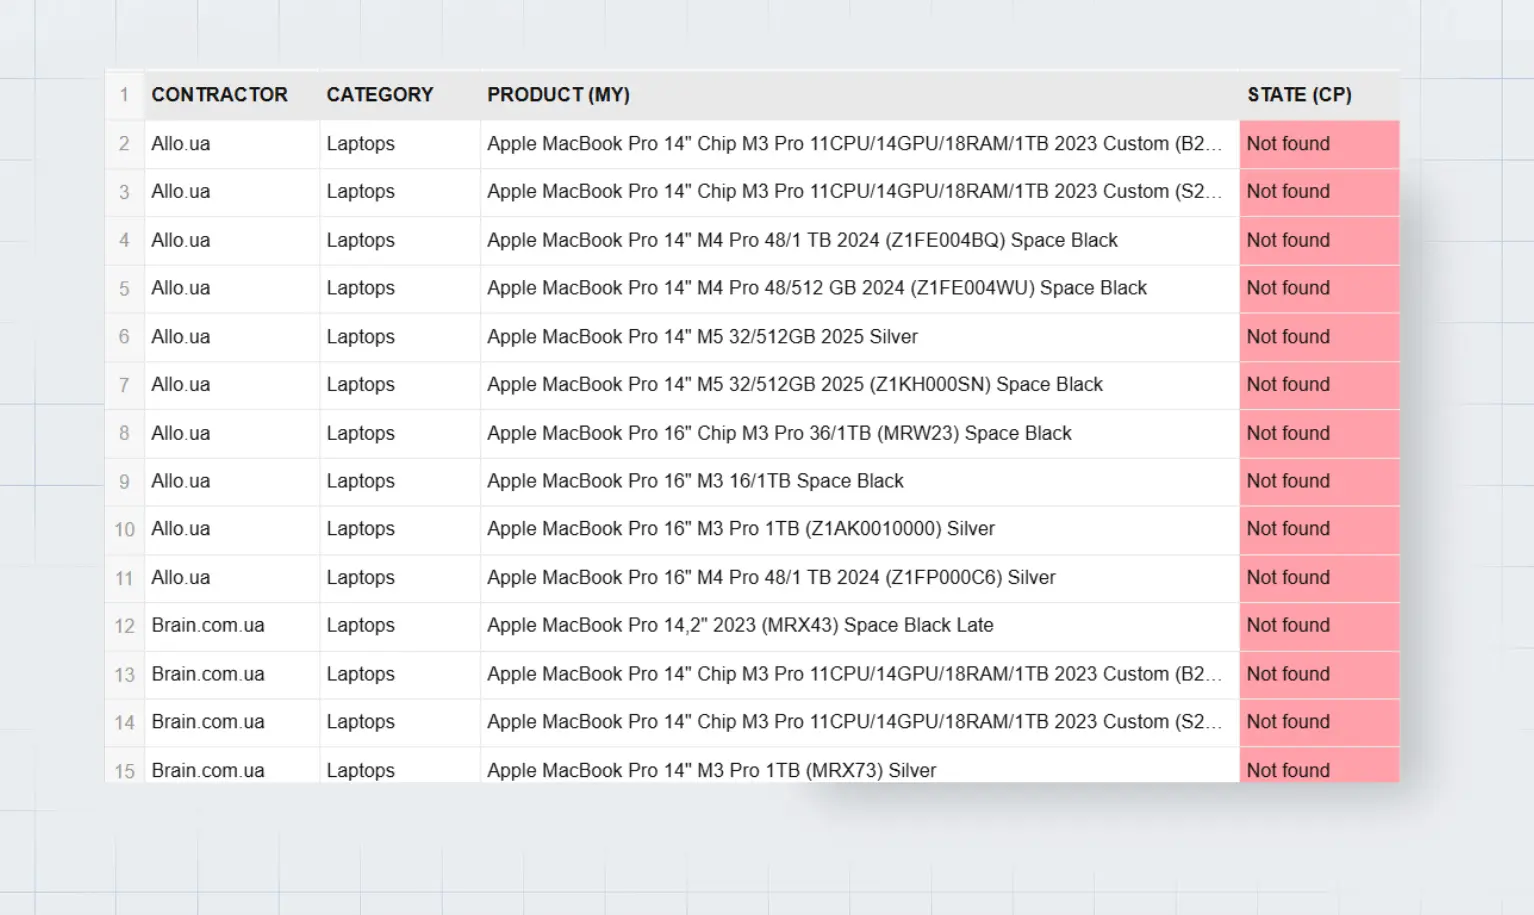
Maria conducts a similar analysis for products that have not been listed on partners’ websites (“Not Found” status).
Possible Next Steps in Assortment Analysis for Brands
For products that are out of stock across different partners, Maria can:
Analyze how long the products have been unavailable
Create a priority list of SKUs for restocking
Send this list to partners
Maria should focus on the most popular models (for example, the report can be filtered by the “Bestseller” tag, assuming this tag was previously assigned to the brand’s best-selling products).
Maria may also create a list of products not listed in online store catalogs and share it with partners. Using this data, she can quickly generate proposals for partners.
Next steps:
Set up regular monitoring (weekly/daily) to add reports on missing products to the dashboard
Track dynamics, measuring progress against the target KPI (+15% digital shelf share)
Create a separate report for popular out-of-stock products and add it to the dashboard for daily monitoring, ensuring that priorities remain in focus and product availability is controlled
Use Case 2. Tracking New Products
As part of assortment presence control, Maria has another task: quickly tracking the addition of new brand models on partners’ websites.
Previously, she checked new products manually by visiting a partner’s website and searching for particular product names. If nothing appeared, several questions arose:
Has the partner not added the product yet?
Or was it added, but the SKU contains an error?
Can it be found by name or configuration?
Each check took time, and the process was inconvenient.
Smart Solution: The “New Product” Tag in Pricer24
To check on new products, Maria now uses the same Assortment Analysis For Brands Report but filtered by the “New arrivals” tag.
Before launching new models to the market, she adds product information to the Pricer24 catalog and assigns the “New arrivals” tag.
In the Assortment Analysis Report, Maria selects the filter: Tag — “New arrivals.”
The report loads information for each partner: how many new products have already been added and how many are still missing.
Maria clicks on the total in the “Not found” column to load a full list of SKUs not yet added by partners.
Maria can now export this list and send it to partner managers, requesting that they add the new products to their websites. Pricer24 gives her full control over the process.
Using Pricer24, a manager always has up-to-date data at hand, can analyze the market situation, and can monitor progress toward KPIs to increase digital shelf share and keep it current:
Ensure maximum product visibility among partners
Minimize the number of products with “Out of Stock” and “Not Found” statuses on partners’ websites
Quickly monitor for the disappearance of items from the market
Manage the addition of new brand products to partner websites
Use Case 3. Analyzing Competitor Brand Presence
Anna is a brand manager at a dog and cat food manufacturer.
Her KPI is to enter the top three brands in terms of presence at key online partners within a year.
Anna knows how many of her brand’s products are listed with online pet store partners. But when it comes to comparing with competitors, challenges arise, as she needs to analyze:
How many SKUs from Royal Canin, Brit, or Josera are listed on the digital shelves of pet stores
How many SKUs are available for purchase, and how many are simply occupying space in partners’ catalogs
Manually counting SKUs using filters on e-commerce websites was time-consuming and still didn’t provide a clear answer. A search result might show 200 products, but it’s hard to immediately see how many are in stock and how many are out of stock.
Now, Anna takes advantage of Pricer24’s automated competitor monitoring.
Smart Solution: Assortment Analysis For Brands Report
The system automatically collects data on all SKUs of each brand across selected partners and tracks their current status daily. As a result, Anna receives not a one-time snapshot that quickly becomes outdated but a continuously updated view of the market, allowing her to compare the presence of her brand with the presence of competitors’ brands.
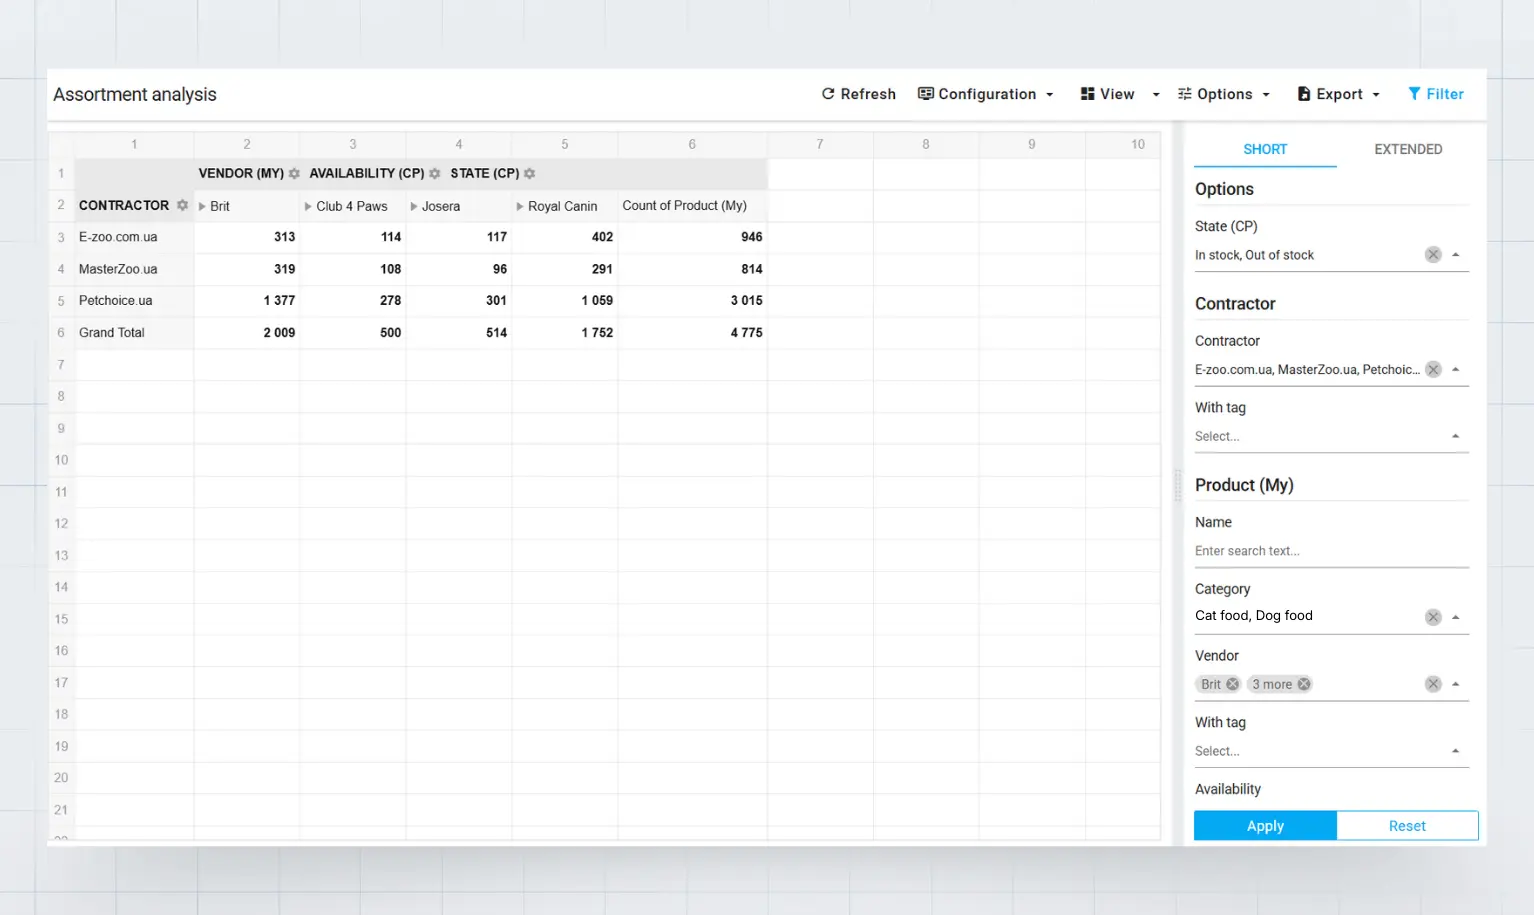
1. Absolute values
The first level is a simple but important table: how many SKUs of each brand are listed in each partner’s catalog.
From this table, Anna can immediately see:
Who is the leader in terms of number of products in the catalog
The actual gap between brands in terms of number of SKUs in partners’ catalogs
Where her brand is falling behind
For example, if Anna’s brand were Club 4 Paws, it would become clear that:
Brit is the leader with the strongest presence across all partners, especially on Petchoice, where it has nearly 1400 SKUs.
Royal Canin is the second leader, almost on par with Brit. Its widest presence is on Petchoice. Across all partners, Brit has four times as many products as Club 4 Paws.
Catching up to Josera in the number of products will be easiest (on MasterZoo, Club 4 Paws even surpasses Josera).
A realistic goal for Anna is to firmly secure third place, overtaking Josera. To catch up with the leaders, she would need to add +1500 SKUs.
Note: We examined a hypothetical scenario and analyzed only four brands (Brit, Club 4 Paws, Josera, and Royal Canin) to demonstrate the platform’s capabilities. In reality, any number of competitors can be added. Additionally, it’s important to keep in mind that differences may stem from both assortment (for example, Club 4 Paws simply has fewer products in its portfolio) and distribution (products exist but are not listed in partners’ catalogs).
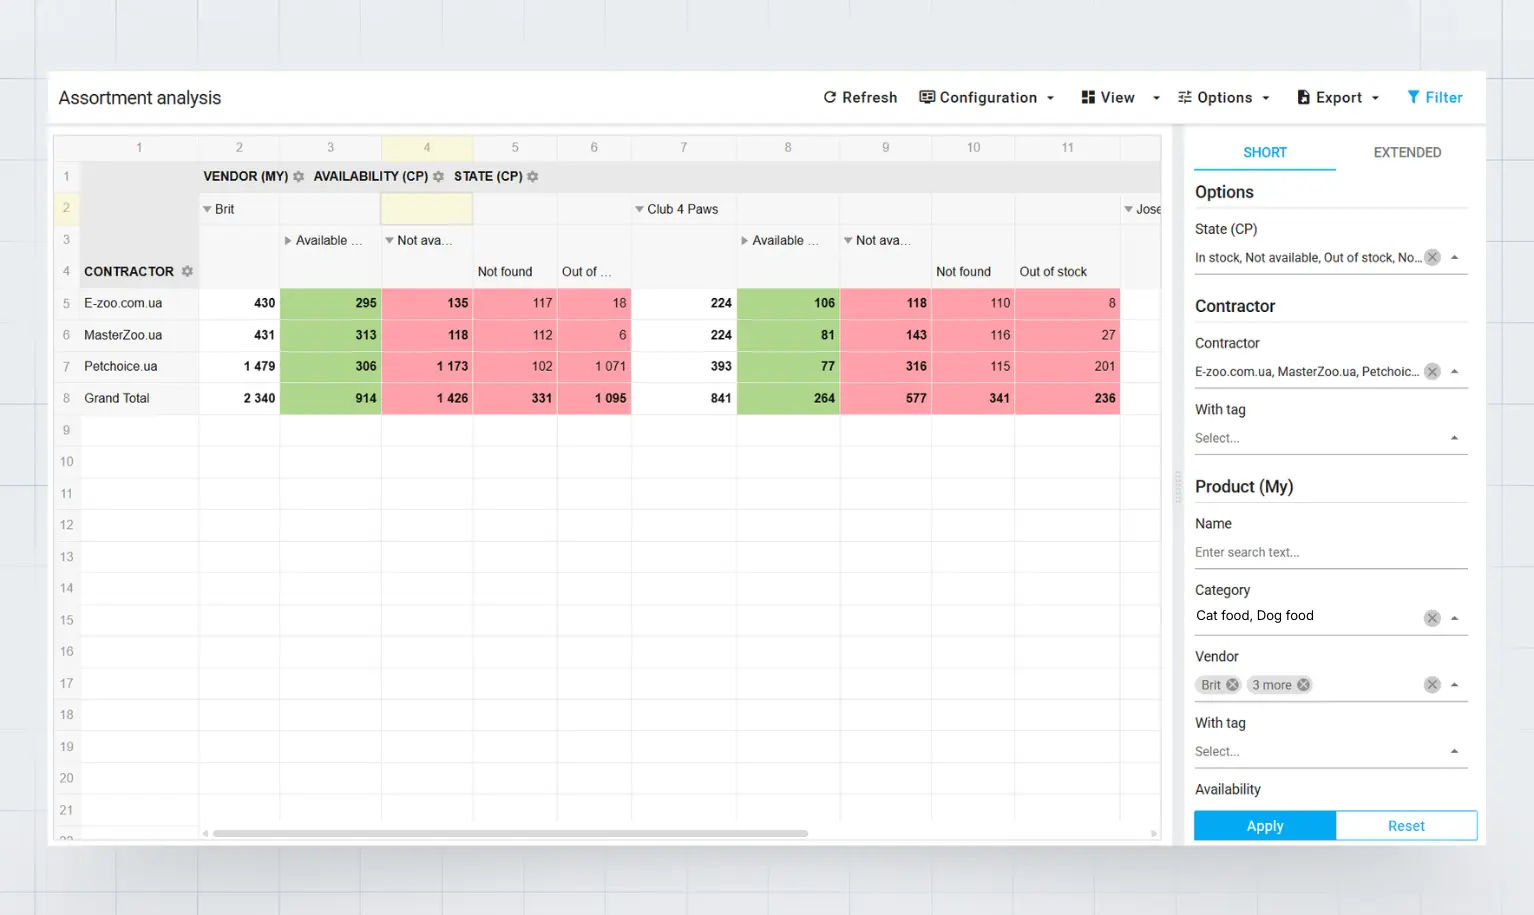
2. Quality of presence: share of products available for purchase
Now we move to the second level of assortment analysis for brands — a table showing distribution by status: “Available for Purchase” and “Out of Stock.”
With both absolute values and status distribution in front of her, Anna no longer evaluates the situation intuitively. She can clearly see how many of her brand’s products (and competitors’ products) are available for purchase on each partner’s digital shelf, where the biggest gaps have formed, and the reasons behind them — whether an insufficient number of SKUs listed on partner sites or stock availability issues.
This data forms the basis for her next steps.
For example, if a significant portion of products are not found” (see Use Case 2), Anna creates a list of SKUs to add and sends it to partners. If a large part of the assortment is out of stock (see Use Case 1), this signals the need to improve the supply chain and restock inventory.
Thanks to continuous data updates, Anna tracks not only current product presence but also stock dynamics. This allows her to set realistic goals, measure progress, and make better operational and strategic decisions.
Analyzing product presence in the market is no longer a one-time study; it becomes a regular practice that helps Anna systematically close the gap with competitors and move toward her KPIs.
Use Case 4. Determining Who Holds the Best Positions in the Category
Alex works as an e-commerce channel sales manager at a company that manufactures small household kitchen appliances.
Last quarter, Alex noticed a 20% drop in sales at a key partner. After analyzing the digital shelf, he discovered that the company’s top models in two main categories were not appearing on the first pages of online store search results.
A product’s position within a category directly affects its visibility to shoppers. Most users only browse the first few pages of a category, so products on the first pages — and especially within the top ten on the first page — receive more clicks and conversions. By tracking product positions, a brand can understand:
whether its products are sufficiently visible
which competitor products dominate the search results
This can also serve as an indicator of which competitor products a particular online store is promoting.
To analyze partner search results, Alex previously had to:
Visit each partner’s website
Search for categories in which the company’s products are represented
Scroll through category pages looking for his company’s models
Record positions in an Excel spreadsheet
Now, the process is simpler and faster: Alex uses the Market Analysis Report in Pricer24.
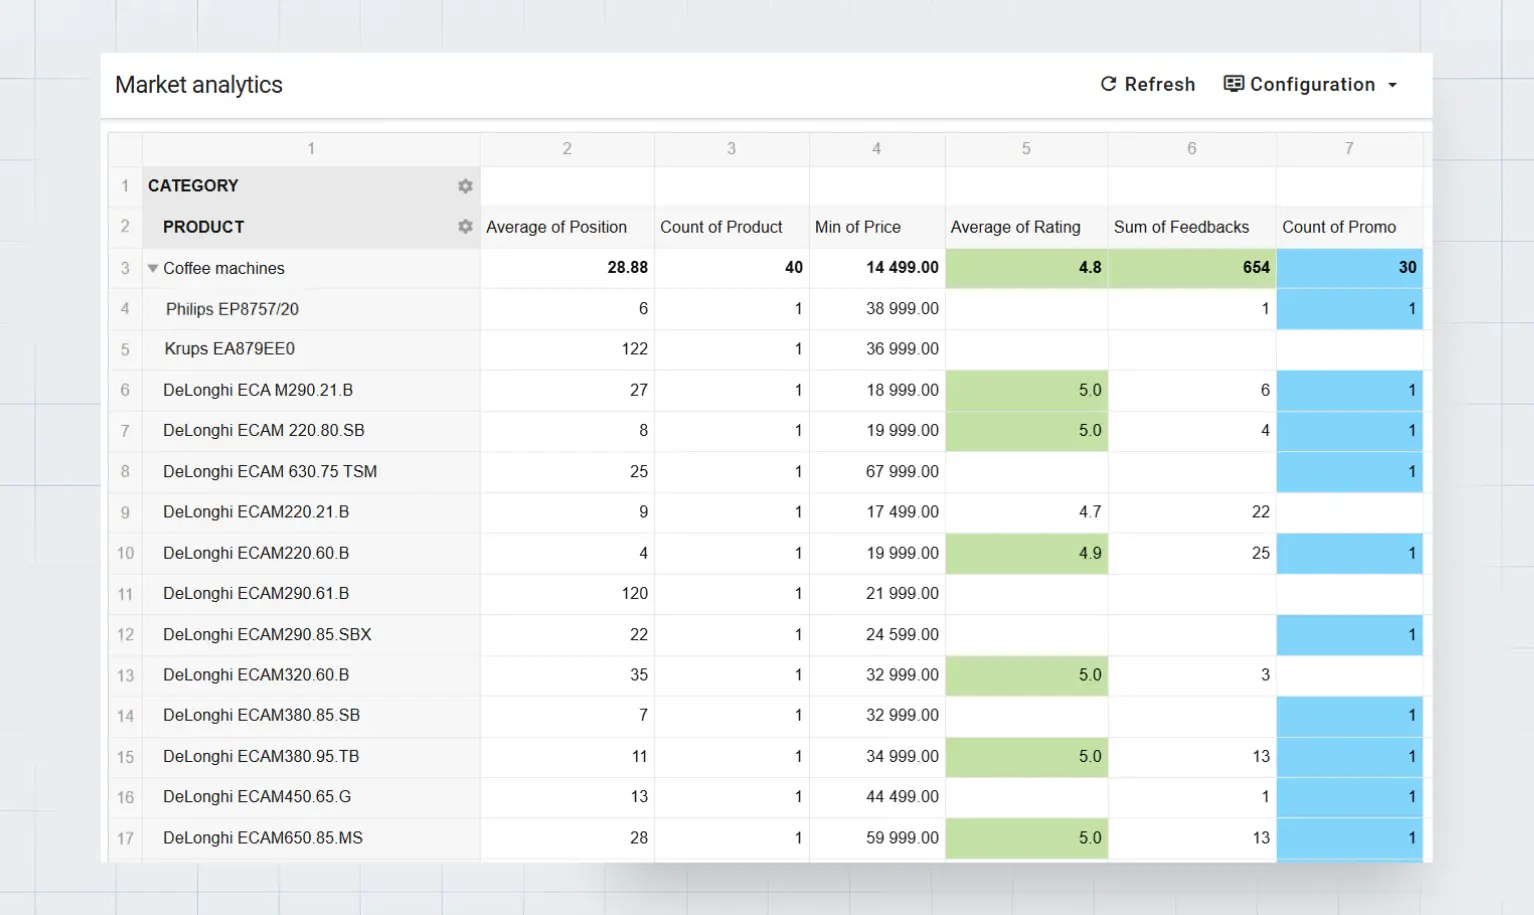
Smart Solution: Market Analysis Report in Pricer24
This report automatically shows each model’s position within category search results on partner websites, as well as the product’s lowest price, number of reviews, and any active promotions.
Now, Alex analyzes product positions in online stores as follows:
Loads the Market Analysis Report → filters by category (e.g., “Coffee Machines”) and by brand (competitor brands and his own brand)
Selects the desired online store from the list (the key partner’s site)
Sees all models (his own and competitors’) in a single table
Sorts by the “Average of Position” column → understands which products are leading in category search results, and also checks minimum position
Identifies who he is competing with for shoppers’ attention by analyzing prices, average ratings, number of reviews, and promotional conditions, if available
Possible Next Steps
Based on the Market Analysis Report, Alex might do the following:
Analyze competitor prices within the top 100 positions and adjust his company’s pricing strategy to increase competitiveness
Discuss opportunities with a key partner to improve product positions, such as through advertising campaigns or special conditions
Add discounts or gifts to top models to boost their appeal
Improve the content in product listings
Use Case 5. Analyzing Top Positions in a Partner’s Catalog
David is the head of online sales at a TV manufacturer.
He wants to understand which product groups are worth promoting with a specific partner. Specifically, he wants to know whether higher- or lower-priced models have greater demand, and whether TVs with larger or smaller screen sizes sell better.
Previously, David did this by:
Visiting the partner’s website
Browsing the Televisions category
Manually recording prices of the top 10 to 20 products by popularity
Trying to determine the characteristics of products in top positions on the category page and making assumptions about future demand
Now he does this automatically using Pricer24.
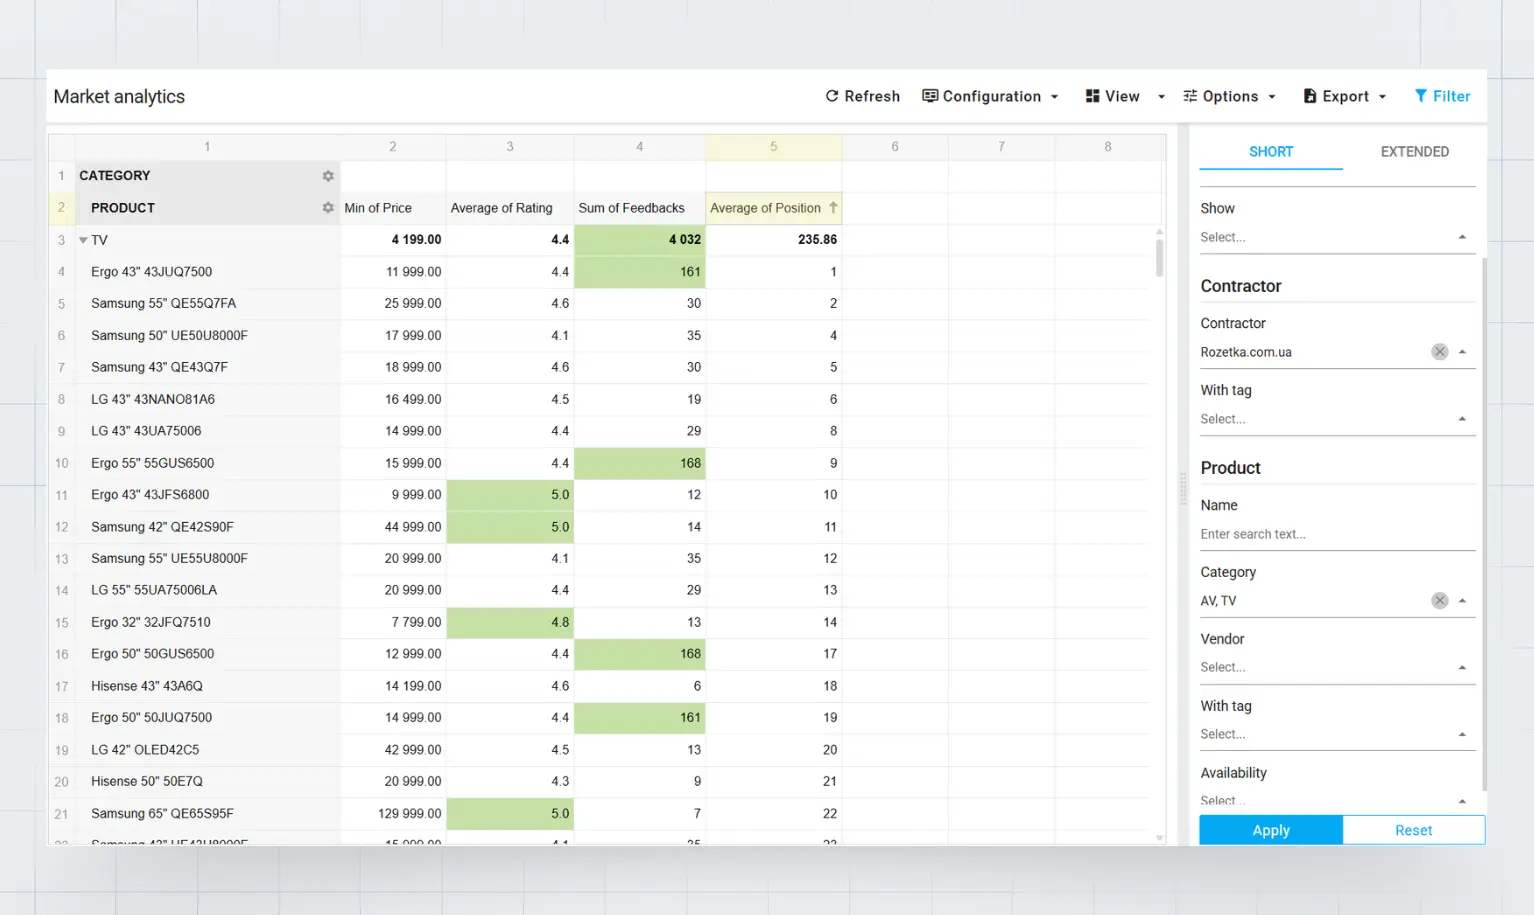
Smart Solution: Analyzing Prices of Top Positions in Search Results
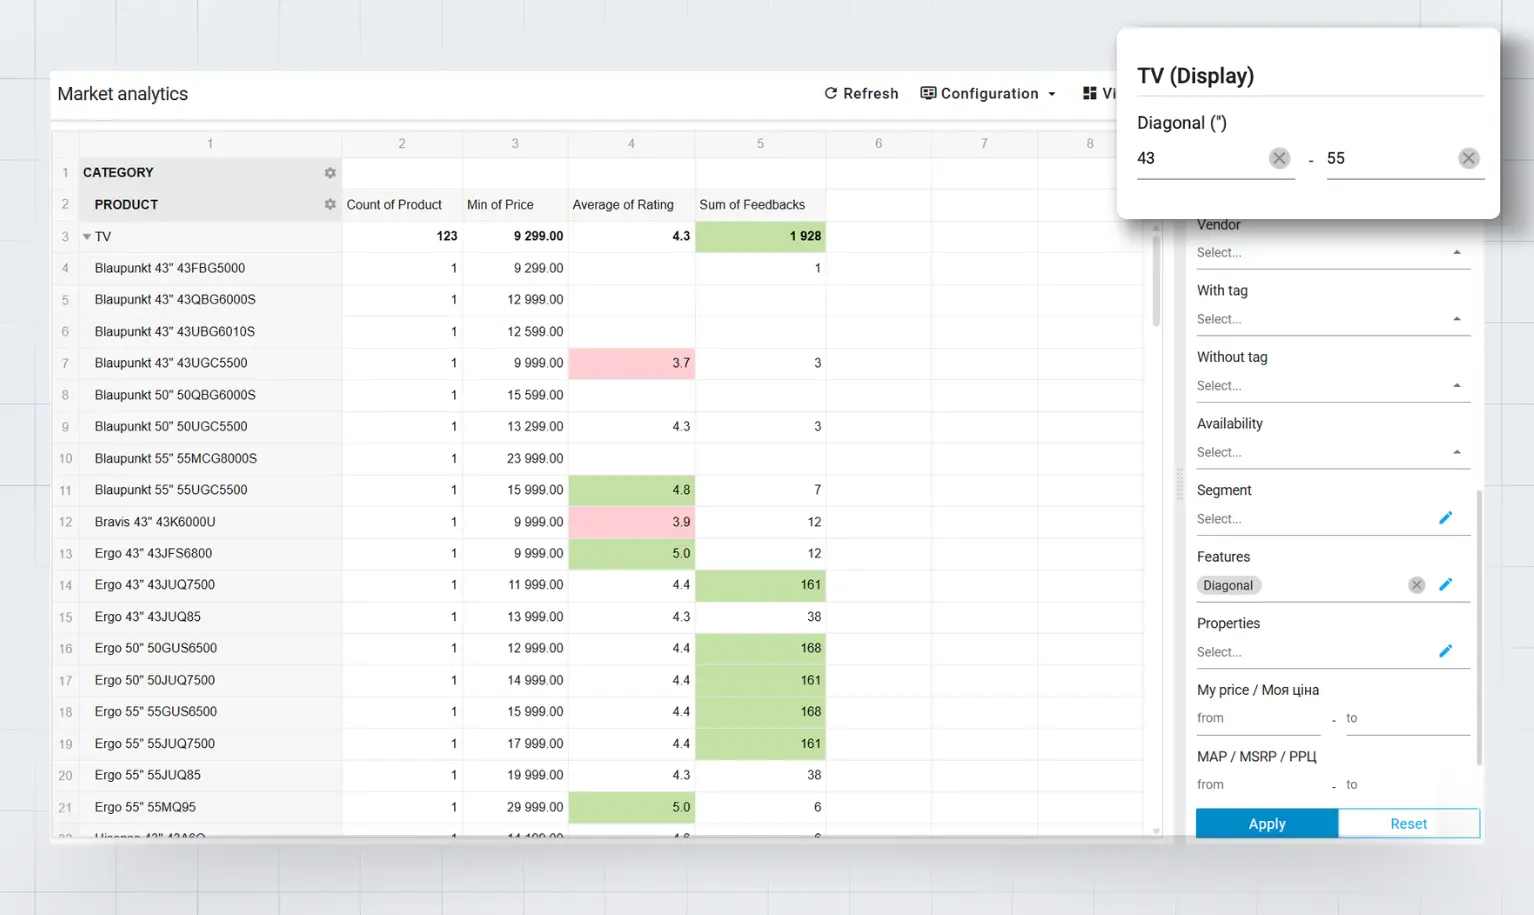
David analyzes which products hold top positions on a partner’s website (Rozetka.com.ua) and what their prices are:
In the Market Analysis Report, he selects the Televisions category and the partner he wants to analyze.
Next, he filters products by position in search results, from lowest to highest.
Finally, he reviews the prices and screen sizes of TVs in top positions on the key partner’s site.
By analyzing the top positions in search results, David observes that:
Models priced between 11,499 and 21,999 UAH (around $250 to $500) dominate, indicating demand in the mid-price segment.
The best positions are held by TVs with 50″, 55″, and 43″ screens — optimal sizes for most buyers.
In this way, David identifies that the Rozetka online shop focuses on budget and mid-range models with 43″–55″ screen sizes. He concludes that for promotion in this online store, it is better to focus on affordable 43″–55″ models in the 12,000–22,000 UAH / $250–$500 price range rather than on expensive large-screen TVs.
Possible Next Steps
David might offer Rozetka special conditions for mid-range models and increase marketing support. But before forming a commercial proposal, David takes one more important step — analyzing competitor prices for 43″–55″ models at key partners.
To do this, he:
Adds other retail partners — Comfy, Citrus, Foxtrot — to the analysis in the same Market Analysis Report
Sets the Specifications filter to screen sizes from 43″ to 55″ to narrow the selection to the target segment
Analyzes the Min Price and Average Rating columns for identical models across different partners
David decides to offer special conditions on the top 15 models with 43″–55″ screens and ratings of 4.5+, reducing the price gap with competitors to 2–3%. Priority is given to models with high ratings but a low number of reviews, aiming to boost sales and build social proof. The expected result is improved positions in search results and increased market share in the 43″–55″ segment.
Conclusion
We have explored only a portion of Pricer24’s capabilities for analyzing the digital shelf.
Pricer24 works like a builder, allowing you to create reports with the parameters and views you need, tailored to the specific analytical task at hand.
By combining these reports, you can:
Monitor your brand’s presence across all partners
Gain deep insight into the competitive environment on each retailer’s shelf
Optimize assortment and promotional strategies based on the specifics of each sales channel
Pricer24 automatically updates data several times a day, so you always see a current view of the market and can quickly respond to changes.
Want to see how Pricer24 could benefit your business? Request a demo and our specialists will show you how it can address your specific needs.
Request a demo to see how Pricer24 can meet your needs
Privacy policy
Your privacy is very important to us. We want your work on the Internet to be as pleasant and useful as possible, and you quite calmly used the broadest range of information, tools and opportunities that the Internet offers.
The personal information of the Members collected at the time of registration (or at any other time) is mainly used to prepare the Products or Services in accordance with your needs. Your information will not be transferred or sold to third parties. However, we may partially disclose personal information in special cases described in the “Consent with the mailing”
What data is collected on the site
At voluntary registration on reception of dispatch you send the Name and E-mail through the registration form.
What is the purpose of this data?
The name is used to contact you personally, and your e-mail for sending you mailings of newsletters, news, useful materials, commercial offers.
Your name and e-mail are not transferred to third parties, under any circumstances, except for cases related to the compliance with the requirements of the law.
You can refuse to receive mailing letters and remove your contact information from the database at any time by clicking on the unsubscribe link present in each letter.
How this data is used
With the help of these data, information on the actions of visitors on the site is collected in order to improve its content, improve the functionality of the site and, as a result, create high-quality content and services for visitors.
You can change your browser settings at any time so that the browser blocks all files or notifies you about sending these files. Note at the same time that some functions and services will not be able to work properly.
How this data is protected
To protect your personal information, we use a variety of administrative, management and technical security measures. Our Company adheres to various international control standards aimed at transactions with personal information, which include certain control measures to protect information collected on the Internet.
Our employees are trained to understand and follow these control measures, they are familiarized with our Privacy Notice, regulations and instructions.
Nevertheless, despite the fact that we are trying to protect your personal information, you too must take measures to protect it.
We strongly recommend that you take all possible precautions while on the Internet. The services and websites that we organize include measures to protect against leakage, unauthorized use and alteration of the information we control. Despite the fact that we are doing everything possible to ensure the integrity and security of our network and systems, we can not guarantee that our security measures will prevent illegal access to this information by hackers from outside organizations.
If this privacy policy is changed, you will be able to read about these changes on this page or, in special cases, receive a notification on your e-mail.